
ANNUAL REPORT 2024
UNIT TRUST CORPORATION ANNUAL REPORT 2024

kerri maharaj
NEW INTERNATIONAL FINANCIAL REPORTING STANDARDS
Each year, new and amended International Financial Reporting Standards (IFRSs) and Interpretations are issued, which the Group must evaluate and adopt where applicable. At times, these may have a significant impact on the Group’s reported results or financial position. The amendments effective 1 January 2024, however, had no material impact on the financial statements for the current or prior periods.
Further information on the new Standards and amendments can be found in Note 2c of the consolidated financial statements.
FAIR VALUE MEASUREMENT
As a reminder, the Group accounts for its investments and other financial assets in accordance with IFRS 9 Financial Instruments. The IFRS requires that their accounting treatment reflect the Group’s business activities, referred to as its business model. The nature of the Group’s business is that Unitholders can redeem their units within established parameters in each Fund, and as such, each Fund’s assets could be sold at any time to fund the redemptions. As a result, the most appropriate measurement basis for the Funds’ investment portfolios is at fair value. This involves valuing each instrument at its market price at the reporting date. Based on the business model adopted by the Group, when prices change and investment values adjust, the IFRS requires that the Group reports these changes in its Consolidated Statement of Profit or Loss.
The important point to note is that market prices continuously fluctuate. Various factors contribute to price movements, resulting in large favourable or unfavourable impacts that are reported in the line item “Net change in fair value of investment securities”. In 2024, this line item was unfavourable—a loss of TT$415Mn in 2023, the Group recorded a favourable movement of TT$20Mn. It is impossible to predict these results in future periods.
While these movements can be unnerving, your investment portfolios are managed by a team of professionals who are trained to look beyond short-term market fluctuations and instead determine whether an investment has value over the long term. Unitholders should therefore try not to be swayed by short-term movements but are encouraged to view the Funds’ performance over a longer period.
The Group’s investment performance and strategy are described extensively in the Chief Investment Officer’s Report.
Consolidated Statement of Financial Position
The Group’s Total Assets remained relatively stable with a 0.5% increase from TT$25.2Bn to TT$25.3Bn. The Group’s investment securities increased by 2.4% or TT$518Mn when compared to 2023, owing to the deployment of surplus cash at the end of 2023 and matured fixed deposits during the year. Of particular note, the Funds experienced net new subscriptions of TT$277Mn in 2024, a reversal of net redemptions of $229M in 2023.
Consolidated Statement of Profit or Loss
The Group’s reported Net income for the year ended 31 December 2024 was TT$19Mn compared to $57Mn for the year ended 31 December 2023, a decrease of TT$38Mn (or 67%) year-over-year. The principal driver for the lower performance was the negative returns on the Trinidad and Tobago stock market—the All T&T Index experienced a 13% decline in 2024.
This decline contributed to a 5% fall in the Growth and Income Fund’s (GIF) Net Asset Value (NAV) from $18.42 as at 31 December 2023 to $17.44 as at 31 December 2024. The NAV decline led to an increase in the Price Guarantee Liability from $9Mn to TT$86Mn and a corresponding charge to the Consolidated Statement of Profit or Loss of TT$83Mn. As a reminder, the GIF provides a capital guarantee for Unitholders who remain invested for a minimum of three years. The guarantee is inversely related to the GIF’s NAV, which means if its NAV falls, the guarantee liability increases. At each reporting period, the Group recognises the full liability to fund the guarantee, although actual Unitholder withdrawals requiring capital reinstatement have historically been a fraction of the actual liability.
Total income, excluding the impact of fair value movements, increased from $895Mn in 2023 to $1Bn in 2024 primarily due to a higher level of Interest income of $146Mn from improved portfolio yields in the Income Funds.
Despite the challenging market conditions, the Group maintained its focus on enhancing Unitholders’ wealth and providing competitive returns. We are pleased to report that distributions paid to investors amounted to TT$495Mn in 2024, representing an increase of TT$186Mn or 60% when compared to 2023.
We remain committed to creating value for our Unitholders, and regardless of the economic environment, we are steadfast in pursuing our pledge to seek maximised Unitholder value and operational efficiency.
kerri maharaj
Chief Financial Officer

crystal rodriguez-greaves
This commitment was driven by sound investment and risk management practices, rigorously informed by comprehensive research that shaped our strategic decisions and their execution. This robust foundation allowed us to not only navigate the year’s volatility effectively but also to actively pursue and capitalize on investment opportunities.
Inside this report you will find comprehensive insights into the macroeconomic landscape of 2024, our investment strategies and their impact on the performance of your funds.
Steady Albeit Muted Global Growth
Global economic growth marginally dipped to 3.2% in 2024, down from a revised 3.3% in 2023. This outturn was primarily driven by a minor decrease in growth in emerging market economies, while growth in advanced economies remained subdued. According to the International Monetary Fund (IMF), the growth rate for emerging market economies in 2024 was 4.2%, down from 4.4% in 2023. In contrast, economic growth in advanced economies held steady at 1.7% in 2024, unchanged from the previous year.
Resilience of the U.S. economy
The U.S. economy delivered stronger-than-expected real GDP growth of 2.8% in 2024, albeit marginally lower than the 2.9% growth in 2023. This was achieved against the backdrop of falling, though still above-target inflation, favourable labour market conditions, and improved consumer and investor sentiment. As a result, the recession fears that loomed over financial markets for much of 2023 and early 2024 significantly receded, and the economy appeared well-poised for a soft landing. In order to bolster the labour market, the U.S. Federal Reserve implemented a 50-basis point reduction in interest rates in September, followed by 25-basis point rate cuts in November and December, totalling 100 basis points for the year. The labour market remained resilient with solid payroll growth, historically low unemployment, and rising wages.
U.S. Equities and Bond Yields Rally
After Donald Trump’s election victory on November 5th, 2024, U.S. markets responded positively, with all three major equity indices reaching record highs. Investor sentiment was driven by optimism about the incoming Trump administration’s economic policies, such as proposed corporate tax cuts and deregulation. Despite a minor pullback in December due to investor profit-taking and concerns over the Fed’s downward revision of projected rate cuts for 2025, the year 2024 was another strong one for U.S. equities. The S&P 500, NASDAQ, and DJIA composite indices posted gains of 23.31%, 28.64%, and 12.88%, respectively.
Notably, much of the gains for the S&P 500 and NASDAQ Composite Indices were driven by a group of predominantly mega-cap technology companies, known as the “Magnificent Seven.” From a sector perspective, ten of the eleven S&P 500 sectors posted positive returns in 2024.
On the fixed income side, bonds in 2024 traded at their highest yields in a decade, offering attractive income-driven returns. The U.S. 10-year Treasury yield, in particular, rose by 69 basis points in 2024, increasing from 3.88% at the start of the year to 4.57% by the end of the year. However, elevated yields depressed fixed-income portfolio valuations, ultimately weighing on overall returns for this asset class, which were lower than in 2023.
The Economic Commission for Latin America and the Caribbean (ECLAC) has estimated that the Caribbean region experienced GDP growth of 8.4% in 2024. However, when excluding the exceptional outlier effect of Guyana’s performance, the region’s overall growth rate is estimated to be more modest, at around 2.6%. Guyana, as highlighted in its 2025 Budget Statement, recorded an impressive 43.6% growth, marking its fifth consecutive year of double-digit GDP expansion. This remarkable growth was primarily driven by a substantial 57.7% surge in the oil sector, coupled with a solid 13.1% increase in the non-oil sector. Meanwhile, economic growth in the Eastern Caribbean Currency Union (ECCU) was estimated at 5% in 2024. This growth
was largely fuelled by strong performances in the tourism and construction sectors, both of which continued to show resilience and expansion throughout the year, contributing significantly to the region’s overall economic performance.
Anemic Growth, Cooling Inflation, and Falling Unemployment
According to the most recent data from the Central Statistical Office (CSO), the domestic economy contracted by 2.1% year-on-year in the second quarter of 2024, a decline from the 0.6% growth observed in the first quarter. This contraction was primarily due to a slowdown in the manufacturing sector, which dropped from 7.0% growth in the first quarter of 2024 to just 1.4% in the second quarter. Additionally, the energy sector experienced declines in both crude oil and natural gas exploration and extraction, further contributing to the overall contraction of the domestic economy. For 2024, the International Monetary Fund forecasts real GDP growth of 1.6%, a modest increase from 1.1% in 2023.
Regarding price levels, headline inflation remained relatively low, measuring 0.5% year-on-year in December 2024, slightly down from 0.7% in December 2023. Over the same period, food inflation rose steadily from -1.1% to 3.5%, while core inflation decreased to -0.3%, down from 1.2%. As for the labour market, the unemployment rate continued its downward trend, falling to 4.1% by the end of the third quarter of 2024, compared to 4.8% in the previous quarter and 5.4% at the end of the first quarter.
Fiscal and Debt Dynamics
Trinidad & Tobago’s budget deficit for the 2024 financial year was estimated to be TT$7.14 billion, financed through a mix of domestic and external sources. Net external financing totaled TT$7.03 billion with TT$115.5 million coming from domestic sources. Notably, a US$750 million government bond was issued on the international market during the year and was oversubscribed. According to the IMF’s latest Article IV report, Trinidad and Tobago’s public sector debt-to-GDP ratio is anticipated to rise to 73.4% in fiscal 2024, up from 70.9% in fiscal 2023. In September 2024, S&P Global Ratings affirmed the country’s “BBB-” long-term sovereign credit rating with a “Stable” outlook. The agency noted the stable outlook reflected its view that the economy will continue to experience low growth, moderate fiscal deficits, and a slowly increasing debt burden over the next two years, while energy exports will support the country’s external balances.
Tight Foreign Exchange Environment
As of December 2024, net official reserves stood at US$5.60 billion, covering 8.0 months of imports, reflecting a 10.5% decrease from the US$6.26 billion recorded at the end of 2023. Meanwhile, the Heritage and Stabilization Fund (HSF) had a net asset value of US$6.1 billion as of September 2024, up from US$5.4 billion in September 2023.
The Central Bank is tasked with supplying a limited foreign exchange pool to commercial banks and authorized dealers who, in turn, prioritize allocations to essential goods and services. While there are no explicit restrictions, access to US dollars for investment purposes was limited suggesting that allocation for investment purposes is a lower priority.
Another Challenging Year for Local Equity
In 2024, the local stock market faced another difficult year, with all three major indices registering declines for the third consecutive year. The TT Composite Index, All T&T Index, and Cross-Listed Index dropped by 11.6%, 12.7%, and 7.7%, respectively, worsening from the 2023 declines of 8.9%, 9.8%, and 5.6%. Sector-wise, despite all sectors posting negative returns, Trading was the best performer with a -0.5% return, followed by Conglomerates at -2.3%, and Banking at -10.5%. The worst-performing sectors were Energy, Manufacturing I and Non-Banking Finance with returns of -56.6%, -31.8%, and -20.7% respectively.
Some stocks saw significant gains, with Endeavour Holdings Limited (EHL) rising by 37.4%, followed by Prestige Holdings Limited (PHL) at 21.5%, and CIBC Caribbean Bank Limited (CIBC) at 15.1%. On the contrary, the worst-performing stocks included L.J. Williams Limited (LJWB) which declined by -66.5% followed by Trinidad and Tobago NGL Limited (NGL) and Guardian Media Limited (GML) with returns of -56.6%, and -45.5% respectively.
Interest Rate Environment and Monetary Policy
In 2024, tight liquidity conditions in the first half of the year led to higher short-term yields due to limited cash availability, with these effects persisting through to September, as noted in the CBTT’s November 2024 Monetary Policy Report. In the latter part of the year, although liquidity improved significantly, new government bond issuances and strong consumer borrowing exerted upward pressure on short-term rates by absorbing excess cash and driving up borrowing costs. Such activity ultimately led to a flattening of the T&T yield curve over the year. The rise in domestic rates, along with US Federal Reserve policy rate cuts in 2024, narrowed the TT/US interest rate differential on 3-month treasuries by 207 basis points, reducing it to -233 bps in November 2024 from -440 bps in November 2023.
In July 2024, the Central Bank reduced the primary reserve requirement for commercial banks from 14% to 10% to improve liquidity, following a decline in excess reserves. By December 2024, commercial banks’ average excess reserves had increased to $6.0 billion, up from $3.5 billion in July. The Central Bank also kept the repo rate unchanged at 3.5% in 2024, citing low inflation, strong credit conditions, ample liquidity, and steady growth in the non-energy sector.
How did the Mutual Funds Perform?

To assist with further understanding the investment results of our funds, the following table provides insights into the performance of each major asset class the funds were invested in during 2024, along with the broad strategy employed for each asset class.
(Scroll within the table to learn more)
| Asset Class | Performance Summary | Strategy |
|---|---|---|
| Local Fixed Income | In 2024, short-term rates remained elevated due to tight liquidity, despite a reduction in commercial banks’ reserve requirements. Yields on the local yield curve, especially for 0–2-year maturities, increased, leading to lower bond prices and valuations for non-traded bonds. Meanwhile, intermediate rates also rose as investors sought a higher term premium for investing in government facilities. | The strategy involved increasing positions in short term securities to benefit from elevated rates while maintaining sufficient liquidity, which allowed for increased payouts. |
| International Fixed Income | Investor sentiment in 2024 was tilted towards equities, resulting in weaker fixed-income performance. Despite the major shift in the U.S. Federal Reserve’s monetary policy in the latter half of 2024 via rate cuts, bond yields remained stubbornly elevated. These increased yields led to lower bond prices and bond valuations. | The strategy focused on capitalizing on the rising U.S. interest rate environment by acquiring higheryielding bonds to maximize returns. |
| Local Equity | The domestic equity market faced significant declines in 2024, with lower trading volumes and reduced market capitalizations for most local stocks. All three major indices registered a third consecutive year of negative growth with the Composite, All T&T and Cross Listed Indices shedding 11.6%, 12.7% and 7.7% respectively. | The strategy involved a cautious approach, given the market’s continued struggles. Focus was on maintaining positions in stable companies with strong fundamentals while managing risk. |
| International Equity | The U.S. equity market performed strongly in 2024, with the S&P 500 gaining 23.3%. Sectors such as Communication Services, Information Technology, and Consumer Discretionary outperformed, while Materials, Health Care, and Real Estate lagged. | The strategy was geared towards capitalizing on strong U.S. market performance by investing in topperforming sectors, particularly those poised for growth. |
Global
The IMF’s January 2025 World Economic Outlook projects global growth at 3.3% for both 2025 and 2026. Growth in emerging market and developing economies is expected to remain flat at 4.2%, while advanced economies will see modest growth of 0.2% to 1.9%. The IMF also notes that despite the global decline in inflation, growing risks—such as geopolitical conflicts, tight monetary policies, financial market volatility, sovereign debt issues, slower growth in China, and increasing protectionism—are overshadowing the economic outlook and could hinder future growth.
U.S.
Despite a rise in equity market volatility and waning consumer and business confidence in the first quarter of 2025, there is no clear evidence at the time of this report of an imminent U.S. recession. While risks to growth persist, particularly from trade tensions and tariffs, these factors are expected to weigh on growth rather than trigger a recession. As a result, growth is expected to remain positive overall in 2025, though at a more moderate pace compared to last year, with the IMF projecting a growth rate of 2.7%. The primary concern remains the impact of increased trade barriers and protectionism on economic momentum. Additionally, despite a recent uptick in probability, the chance of a U.S. recession remains relatively low at 30% at the end of March according to Bloomberg. Inflation has continued on a downward trajectory, though it remains outside of the Fed’s preferred target range. Based on this trend, market analysts and Fed officials anticipate at least two rate cuts in 2025. The stability of the labour market should also help reduce the risk of a significant decline in consumer spending.
Local
According to the IMF, the local economy is projected to experience growth of 2.4% in 2025. However, challenges persist, particularly in the energy sector, due to limited natural gas availability, aging infrastructure, and delays in the development of the Dragon Gas Field. In February 2025, U.S. President Donald Trump announced the termination of Chevron Corporation’s license to pump and export Venezuelan oil, raising concerns about the future of Trinidad and Tobago’s license with Shell regarding the Dragon Gas field.
In the short to medium term, economic growth is expected to be driven by rising business activity and private consumption. Low inflation and sustained wage growth will support consumer spending, but the IMF warns that recent increases in the minimum wage and public sector wage settlements could pressure domestic prices. Additionally, geopolitical tensions and adverse weather events may further increase price pressures.
The country’s trade balance is facing a decline in the current account surplus due to falling energy prices, while increased domestic spending raises demand for imports. In the current fiscal year, the country’s total revenue is projected at TT$54.22 billion, with expenditure at TT$59.74 billion, leading to a deficit of around $5.52 billion (2.9% of GDP) as per the 2025 Budget. A narrowing of the fiscal deficit is however expected over time as efforts are taken to address the growing debt load and to keep expenditure growth under control.

We navigated a year of varied market conditions, achieving strong results in key areas: the Income Funds achieved increased returns and distribution rates, strategic diversification within the Growth & Income Fund and Universal Retirement Fund effectively minimized the impact of local equity market declines and our Global Select Funds also benefited from the robust performance of US equity markets, generating positive returns.
As we look forward, we acknowledge the potential for significant uncertainties, including international trade tensions and possible local energy sector adjustments. We remain vigilant, continuously monitoring market dynamics and strategically positioning our portfolios to achieve the respective objectives of each fund, ensuring long-term value for you, our unitholders.
CRYSTAL RODRIGUEZ-GREAVES
Chief Investment Officer
Funds Under Management ($m)
| DESCRIPTION | 2015 | 2016 | 2017 | 2018 | 2019 | 2020 | 2021 | 2022 | 2023 | 2024 |
|---|---|---|---|---|---|---|---|---|---|---|
| Growth and Income Fund | 4,645.30 | 4,733.11 | 4,865.03 | 4,882.10 | 5,353.50 | 5,253.94 | 5,875.19 | 5,190.66 | 4,970.76 | 4,598.84 |
| TT Dollar Income Fund | 10,657.14 | 10,837.89 | 10,949.81 | 11,176.65 | 11,554.61 | 12,393.94 | 12,291.07 | 12,126.24 | 12,210.34 | 12,428.93 |
| Universal Retirement Fund | 288.27 | 304.90 | 299.52 | 297.29 | 346.51 | 371.92 | 443.53 | 403.18 | 409.62 | 409.00 |
| US Dollar Income Fund | 4,111.07 | 4,228.25 | 4,164.63 | 4,082.67 | 3,941.87 | 4,108.36 | 4,417.42 | 4,968.70 | 5,076.71 | 5,252.35 |
| UTC Corporate Fund | 26.80 | 12.60 | 5.12 | 5.20 | 22.59 | 309.23 | 537.15 | 577.72 | 545.07 | 518.33 |
| UTC Calypso Macro Index Fund | 556.55 | 547.92 | 473.56 | 516.97 | 425.92 | 545.60 | 634.20 | 594.87 | 569.42 | |
| Global Investor Select ETF Fund SP - Conservative | 5.63 | 7.87 | 7.95 | 8.40 | 7.52 | 6.88 | 6.97 | |||
| Global Investor Select ETF Fund SP - Moderate | 5.91 | 7.76 | 10.51 | 11.94 | 10.87 | 10.44 | 9.95 | |||
| Global Investor Select ETF Fund SP - Aggressive | 5.71 | 10.05 | 8.07 | 9.38 | 8.32 | 7.96 | 7.95 | |||
| UTC North American Fund | 245.62 | 281.20 | 298.85 | 0.00 | 0.00 | 0.00 | 0.00 | 0.00 | 0.00 | 0.00 |
| Pension and Other Funds | 582.13 | 645.87 | 783.95 | 797.88 | 838.70 | 682.57 | 750.46 | 693.45 | 656.60 | 370.69 |
| Treasury portfolio | 60.28 | |||||||||
| Total Funds Under Management ($m) | 20,616.61 | 21,600.37 | 21,914.83 | 21,732.61 | 22,600.43 | 23,572.42 | 24,890.14 | 4,620.86 | 24,489.24 | 24,172.43 |
Mutual Fund Sales ($m)
| DESCRIPTION | 2015 | 2016 | 2017 | 2018 | 2019 | 2020 | 2021 | 2022 | 2023 | 2024 |
|---|---|---|---|---|---|---|---|---|---|---|
| Growth and Income Fund | 575.43 | 510.09 | 508.60 | 706.77 | 712.79 | 455.60 | 513.95 | 566.25 | 426.26 | 435.83 |
| TT Dollar Income Fund | 3,421.82 | 3,790.25 | 3,765.99 | 3,563.40 | 3,497.66 | 3,084.02 | 2,654.89 | 2,693.39 | 3,095.20 | 3,267.32 |
| Universal Retirement Fund | 37.34 | 37.22 | 32.56 | 30.80 | 40.46 | 34.59 | 39.15 | 38.16 | 34.00 | 33.33 |
| US Dollar Income Fund | 1,036.16 | 809.85 | 623.59 | 694.39 | 523.52 | 660.36 | 806.34 | 2,052.90 | 1,593.43 | 876.58 |
| UTC Corporate Fund | 31.10 | 0.17 | 0.10 | 0.07 | 17.30 | 484.62 | 285.33 | 381.19 | 235.92 | 69.52 |
| Global Investor Select ETF Fund SP - Conservative | 5.70 | 1.81 | 0.08 | 0.00 | 0.00 | 0.00 | 0.00 | |||
| Global Investor Select ETF Fund SP - Moderate | 6.00 | 3.73 | 0.12 | 0.53 | 0.07 | 0.00 | 0.00 | |||
| Global Investor Select ETF Fund SP - Aggressive | 5.82 | 1.87 | 0.14 | 0.49 | 0.00 | 0.00 | 0.00 | |||
| UTC North American Fund | 2.19 | 4.78 | 1.82 |
TOTALS
| DESCRIPTION | 2015 | 2016 | 2017 | 2018 | 2019 | 2020 | 2021 | 2022 | 2023 | 2024 |
|---|---|---|---|---|---|---|---|---|---|---|
| Total Sales ($m) | 5,104.04 | 5,152.36 | 4,932.66 | 5,012.95 | 4,799.14 | 4,719.54 | 4,300.69 | 5,731.96 | 5,384.81 | 4,682.58 |
| Funds Mobilised to date ($m) | 114,231.42 | 119,383.78 | 124,316.44 | 129,329.39 | 134,128.53 | 138,848.07 | 143,148.75 | 148,880.71 | 154,265.52 | 158,948.10 |
| Unitholder Accounts to date | 855,463.00 | 865,196.00 | 873,376.00 | 882,914.00 | 894,447.00 | 902,244.00 | 909,639.00 | 888,545.00 | 902,359.00 | 918,566.00 |
|
TOP TEN HOLDINGS As at 31 December 2024 |
% of Securities 2024 |
|---|---|
| Government of Trinidad & Tobago TT$2.0Bn Tranche 3 TT$600Mn 6.55% FXRB Due 2042 | 5.16% |
| Government of Trinidad & Tobago TT$1.10Bn Tranche 2 TT$550Mn 5.90% FXRB Due 2036 | 4.64% |
| Government of Trinidad & Tobago TT$2.0Bn Tranche 1 TT$1.0Bn 4.34% FXRB Due 2029 | 4.23% |
| Government of Trinidad & Tobago TT$1.0Bn Tranche 1 TT$600Mn 4.44% FXRB Due 2032 (VAT Bonds) | 3.38% |
| Government of Trinidad & Tobago 15 Years TT$2.5Bn 5.20% FXRB Due 2027 | 3.18% |
| Government of Trinidad & Tobago Certificate of Participation Due 2028 | 2.87% |
| Government of Trinidad & Tobago TT$3.0Bn 3.15% FXRB Due 2026 (VAT Bonds) | 2.68% |
| NIPDEC Trinidad and Tobago 1Bn 4% 16 Years Due 2029 | 2.59% |
| Government of Trinidad & Tobago TT$1.0Bn 3.71% 4-Year FXRB Due 2027 | 2.57% |
| UDECOTT TT$3.40Bn 15 Year Variable Rate Bond Due 2028 | 2.41% |
| TOTAL | 33.71% |
|
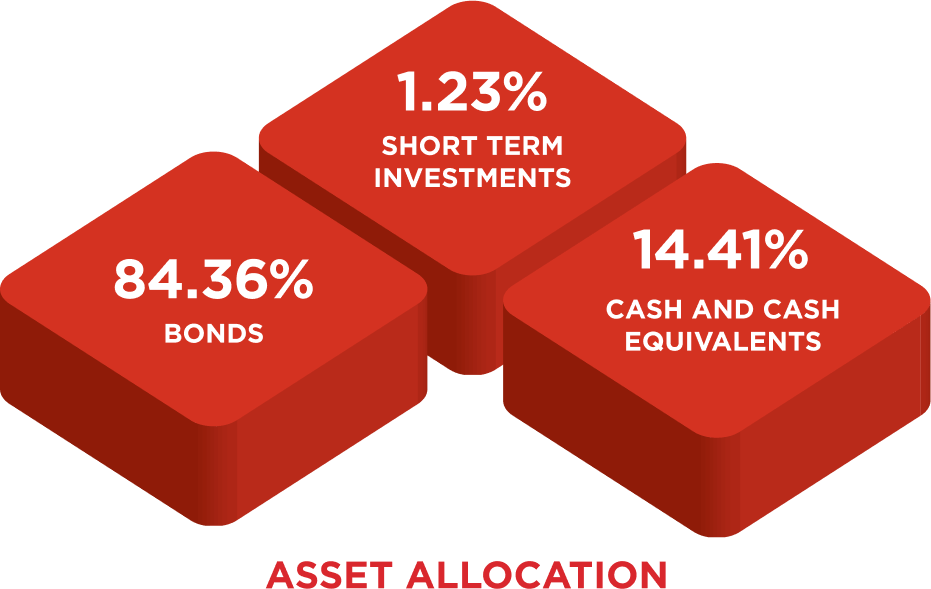
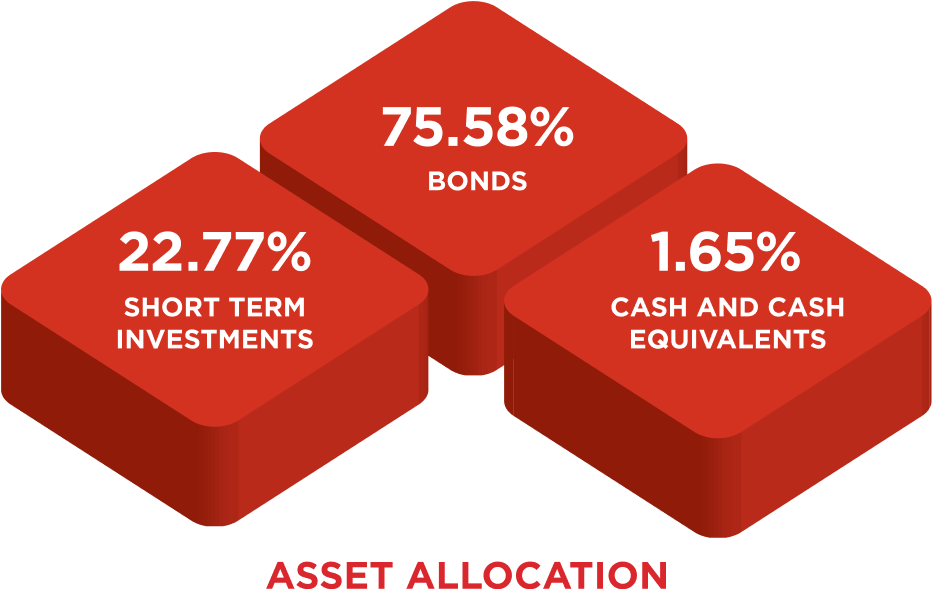
PORTFOLIO OF INVESTMENTS As at 31 December 2024 | Expressed in Trinidad & Tobago Dollars |
Market Value 2024 TT$ |
|---|---|
| Corporate Securities | 3,545,320,120 |
| Government and Government Guaranteed Securities | 6,940,437,700 |
| Short Term Investments | 152,500,000 |
| Deposits with Banks | 954,777,632 |
| Cash and Cash Equivalents | 756,257,178 |
| Other Assets in Excess of Liabilities | 79,641,120 |
| TOTAL NET ASSETS | 12,428,933,750 |
|
TOP TEN HOLDINGS As at 31 December 2024 |
% of Securities 2024 |
|---|---|
| First Citizens Bank Limited US$67.051Mn 3.25% 5 year FXB due 2026 | 3.26% |
| Trinidad and Tobago Generation Unlimited US$600Mn 11 year 5.25% FXRB November 2027 | 2.77% |
| Government of Trinidad and Tobago US$100Mn 6.65% 3-Yr FXB Due 2027 | 1.53% |
| Heritage Petroleum Company Ltd US$500Mn 9.0% Senior Secured Fixed Rate Facility due 2029 | 1.42% |
| NCB Financial Group Ltd US$75Mn 8.50% Term Loan due 5th May 2026 | 1.39% |
| Sumitomo Mitsui Financial Group US1.1Bn FXB Due 14th September 2028 | 1.38% |
| Concentrix Corporation US$800Mn 6.65% FXRB due 2nd August 2026 | 1.37% |
| Bank of Nova Scotia US$750Mn FXB due 12th June 2028 | 1.37% |
| Government of Trinidad and Tobago US$1.0Bn 4.5% FXRB due 2026 | 1.32% |
| Mohawk Industries INC US$600Mn FXB Due 18th September 2028 | 1.25% |
| TOTAL | 17.06% |
|
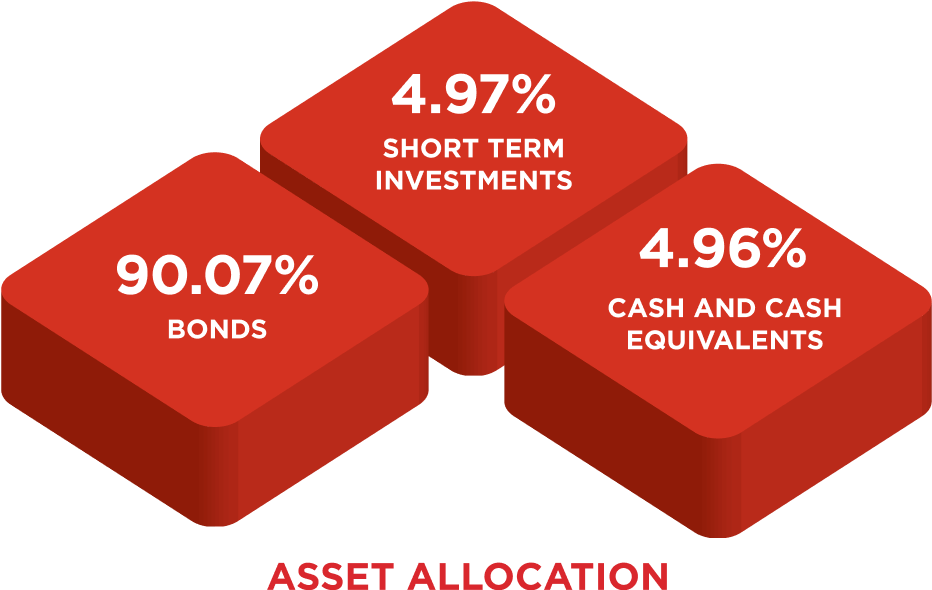
PORTFOLIO OF INVESTMENTS As at 31 December 2024 | Expressed in United States Dollars |
Market Value 2024 US$ |
|---|---|
| Corporate Securities | 657,989,975 |
| Government and Government Guaranteed Securities | 44,047,600 |
| Short Term Investments | 38,693,001 |
| Cash and Cash Equivalents | 31,992,814 |
| Other Assets in Excess of Liabilities | 6,684,408 |
| TOTAL NET ASSETS | 779,407,798 |
|
TOP TEN HOLDINGS As at 31 December 2024 |
% of Securities 2024 |
|---|---|
| Vanguard S&P 500 Exchange Traded Fund | 9.23% |
| iShares S&P 500 Index Fund | 9.22% |
| Republic Financial Holdings Limited Common Shares | 9.03% |
| Scotiabank Trinidad and Tobago Limited Common Shares | 5.92% |
| Massy Holdings Limited Common Shares | 5.84% |
| First Citizens Group Financial Holdings Limited Common Shares | 5.35% |
| ANSA McAL Limited Common Shares | 4.12% |
| Government of Trinidad and Tobago US$1.0Bn 4.5% FXRB due 2026 | 3.96% |
| Calypso Macro Index Fund | 3.11% |
| Government of Trinidad & Tobago T$1.5Bn FXRB 6.0% due 2031 | 2.57% |
| TOTAL | 58.35% |
|
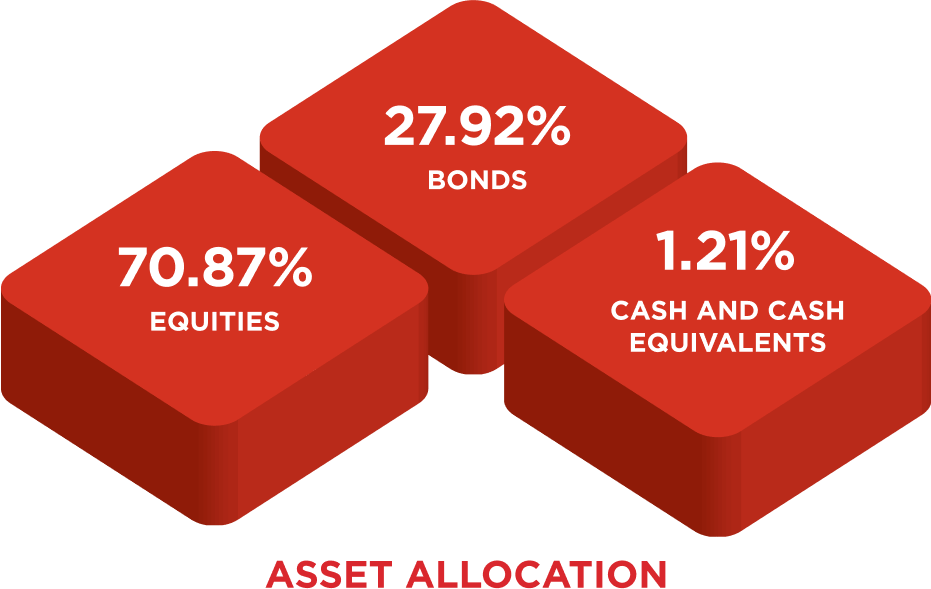
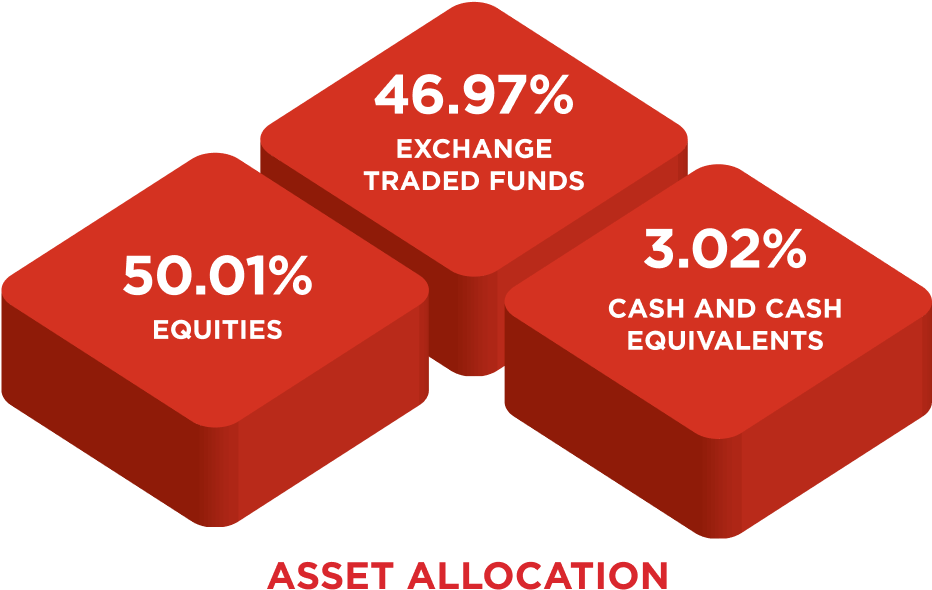
PORTFOLIO OF INVESTMENTS As at 31 December 2024 | Expressed in Trinidad & Tobago Dollars |
Market Value 2024 TT$ |
|---|---|
| Corporate Securities | 788,881,568 |
| Government and Government Guaranteed Securities | 495,321,556 |
| Equities | 3,258,994,413 |
| Cash and Cash Equivalents | 102,596,690 |
| Other Liabilities in Excess of Assets | (46,952,425) |
| TOTAL NET ASSETS | 4,598,841,801 |
|
TOP TEN HOLDINGS As at 31 December 2024 |
% of Securities 2024 |
|---|---|
| Vanguard Energy Exchange Traded Fund | 14.4% |
| Energy Select Sector SPDR Exchange Traded Fund | 13.98% |
| iShares US Energy Exchange Traded Fund | 13.27% |
| Republic Financial Holdings Limited Common Shares | 11.41% |
| iShares Global Energy Sector Index Fund | 6.78% |
| ANSA McAL Limited Common Shares | 6.63% |
| First Citizens Group Financial Holdings Limited Common Shares | 6.41% |
| Scotiabank Trinidad and Tobago Limited Common Shares | 6.36% |
| Massy Holdings Limited Common Shares | 4.84% |
| British American Tobacco PLC - ADR | 4.78% |
| TOTAL | 88.86% |
|
PORTFOLIO OF INVESTMENTS As at 31 December 2024 | Expressed in Trinidad & Tobago Dollars |
Market Value 2024 TT$ |
|---|---|
| Equities | 284,766,782 |
| Exchange Traded Funds | 267,445,315 |
| Cash and Cash Equivalents | 18,692,506 |
| Other Liabilities in Excess of Assets | (1,482,289) |
| TOTAL NET ASSETS | 569,422,314 |
|
TOP TEN HOLDINGS As at 31 December 2024 |
% of Securities 2024 |
|---|---|
| First Caribbean International Bank TT$70Million 3.50% 2 Year Fixed Deposit Due October 2025 | 13.73% |
| Government of Trinidad and Tobago TT$2.50 Billion Triple Tranche 2 TT$425Mn 4.96% Fixed Rate Bond Due June 2033 | 13.54% |
| Housing Development Corporation TT$700Mn 4.00% FRL Due 2030 | 11.83% |
| First Citizens Bank Limited TT$1.0Bn 4.90% 6yr FXRB Due 2030 | 9.94% |
| Guardian Holdings Limited TT$1.02Bn 5.00% FXRB Due 2025 | 9.90% |
| Certificate of Interest in Government of Trinidad and Tobago TT$2.0Bn Triple Tranche FXRB Due 2029 | 8.59% |
| UDECOTT TT$100Mn 2.95% 5 year FXR Government of Trinidad and Tobago Guaranteed Loan Due 2026 | 4.91% |
| Government of Trinidad and Tobago TT$150Mn 4.50% 5-year FXRB Due 01-March-2029 | 4.89% |
| Government of Trinidad and Tobago TT$2.50Bn Triple Tranche 1 TT$1.2Bn 4.30% Fixed Rate Bond Due November 2028 | 4.89% |
| Republic Bank Limited TT$500Mn 5.50% 10 year Unsecured Sub FXRB Due 2034 | 4.87% |
| TOTAL | 87.09% |
|
PORTFOLIO OF INVESTMENTS As at 31 December 2024 | Expressed in Trinidad & Tobago Dollars |
Market Value 2024 TT$ |
|---|---|
| Government Securities | 265,789,365 |
| Corporate Securities | 125,969,265 |
| Commercial Paper | 18,000,000 |
| Deposits with Banks | 100,000,000 |
| Cash and Cash Equivalents | 9,710,780 |
| Other Liabilities in Excess of Assets | (1,137,102) |
| TOTAL NET ASSETS | 518,332,308 |
|
TOP TEN HOLDINGS As at 31 December 2024 |
% of Securities 2024 |
|---|---|
| Vanguard S&P 500 Exchange Traded Fund | 9.73% |
| iShares S&P 500 Index Fund | 9.73% |
| Republic Financial Holdings Limited Common Shares | 8.63% |
| SPDR S&P 500 Index Fund | 7.81% |
| Massy Holdings Limited Common Shares | 5.31% |
| Citicorp Certificate of Participation in Government of Trinidad & Tobago Series 30 Bond 4.15% due 2027 | 5.17% |
| Scotiabank Trinidad and Tobago Limited Common Shares | 5.02% |
| First Citizens Group Financial Holdings Limited Common Shares | 4.69% |
| CVS Health Corp. US$1.7Bn 5.25% FXB Due 21st February 2033 | 4.26% |
| ANSA McAL Limited Common Shares | 3.02% |
| TOTAL | 63.37% |
|
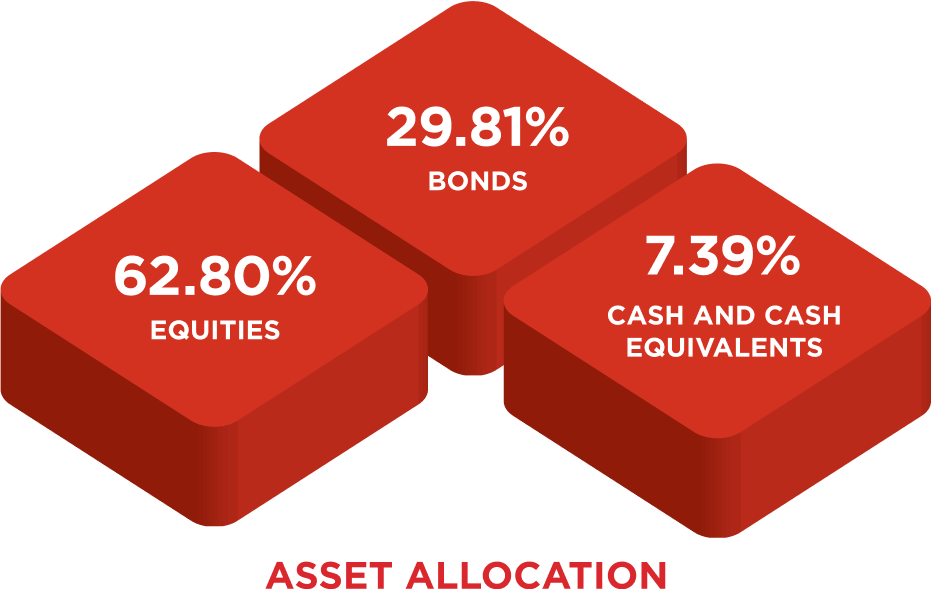
PORTFOLIO OF INVESTMENTS As at 31 December 2024 | Expressed in Trinidad & Tobago Dollars |
Market Value 2024 TT$ |
|---|---|
| Corporate Securities | 73,937,832 |
| Government and Government Guaranteed Securities | 47,997,159 |
| Equities | 256,866,838 |
| Cash and Cash Equivalents | 30,396,495 |
| Other Liabilities in Excess of Assets | (201,995) |
| TOTAL NET ASSETS | 408,996,329 |
|
TOP FIVE HOLDINGS As at 31 December 2024 |
% of Securities 2024 |
|---|---|
| iShares Core US Aggregate Exchange Traded Fund | 10.42% |
| iShares iBoxx Investment Grade Corporate Bond Exchange Traded Fund | 10.38% |
| iShares 7- 10 years Treasury Bond | 10.36% |
| SPDR S&P 500 Exchange Traded Fund Trust | 10.22% |
| Vanguard FTSE Developed Exchange Traded Fund | 10.11% |
| TOTAL | 51.49% |
|
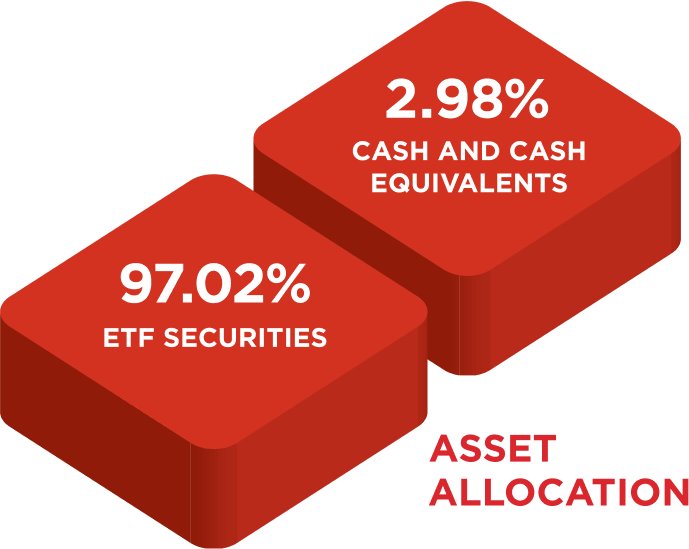
PORTFOLIO OF INVESTMENTS As at 31 December 2024 | Expressed in United States Dollars |
Market Value 2024 US$ |
|---|---|
| Equity Exchange Traded Fund Securities | 1,003,433 |
| Cash and Cash Equivalents | 34,137 |
| Other Liabilities in Excess of Assets | (3,358) |
| TOTAL NET ASSETS | 779,407,798 |
|
TOP FIVE HOLDINGS As at 31 December 2024 |
% of Securities 2024 |
|---|---|
| IShares 7-10 Year Treasury Bond | 9.74% |
| IShares IBoxx $ Investment Grade Corporate Bond | 9.69% |
| SPDR S&P 500 Exchange Traded Fund Trust | 8.76% |
| Vanguard Global ex-US Real Estate Exchange Traded Fund | 8.51% |
| ISharesCore US Aggregate | 7.83% |
| TOTAL | 44.53% |
|
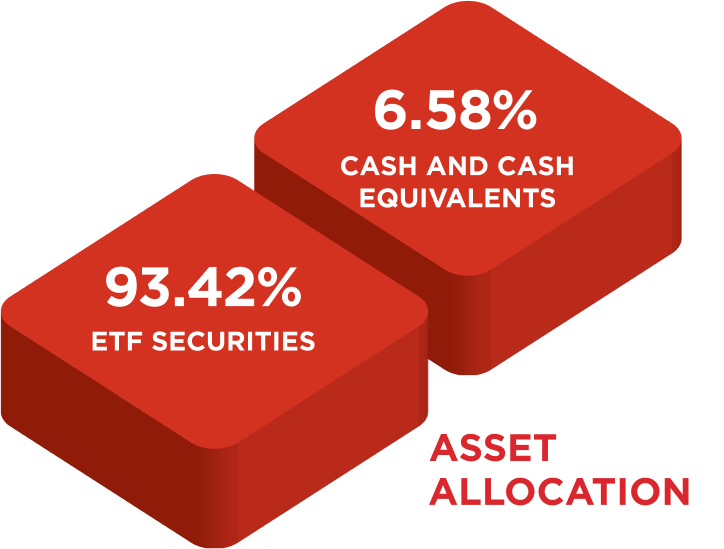
PORTFOLIO OF INVESTMENTS As at 31 December 2024 | Expressed in United States Dollars |
Market Value 2024 US$ |
|---|---|
| Equity Exchange Traded Fund Securities | 1,378,428 |
| Cash and Cash Equivalents | 101,254 |
| Other Liabilities in Excess of Assets | (4,087) |
| TOTAL NET ASSETS | 1,475,594 |
|
TOP FIVE HOLDINGS As at 31 December 2024 |
% of Securities 2024 |
|---|---|
| Vanguard Small Cap Exchange Traded Fund | 10.12% |
| SPDR S&P 500 Exchange Traded Fund Trust | 9.99% |
| Vanguard FTSE Developed Exchange Traded Fund | 9.77% |
| Vanguard Global ex-US Real Estate Exchange Traded Fund | 9.36% |
| Vanguard REIT Exchange Traded Fund | 9.32% |
| TOTAL | 48.56% |
|
PORTFOLIO OF INVESTMENTS As at 31 December 2024 | Expressed in United States Dollars |
Market Value 2024 US$ |
|---|---|
| Equity Exchange Traded Fund Securities | 1,156,058 |
| Cash and Cash Equivalents | 27,616 |
| Other Liabilities in Excess of Assets | (3,854) |
| TOTAL NET ASSETS | 1,179,820 |
Next Chapter